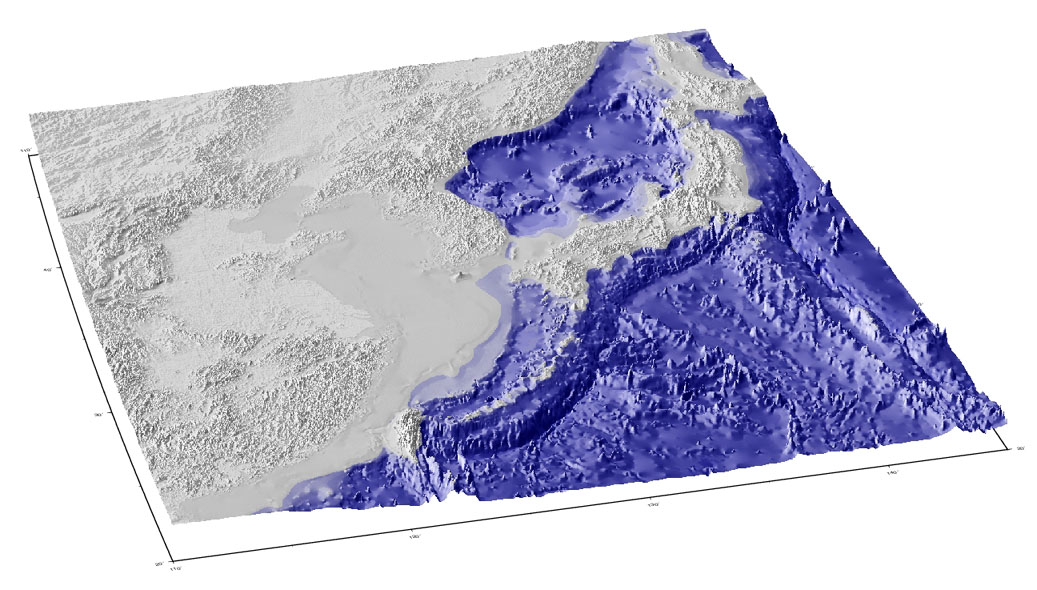
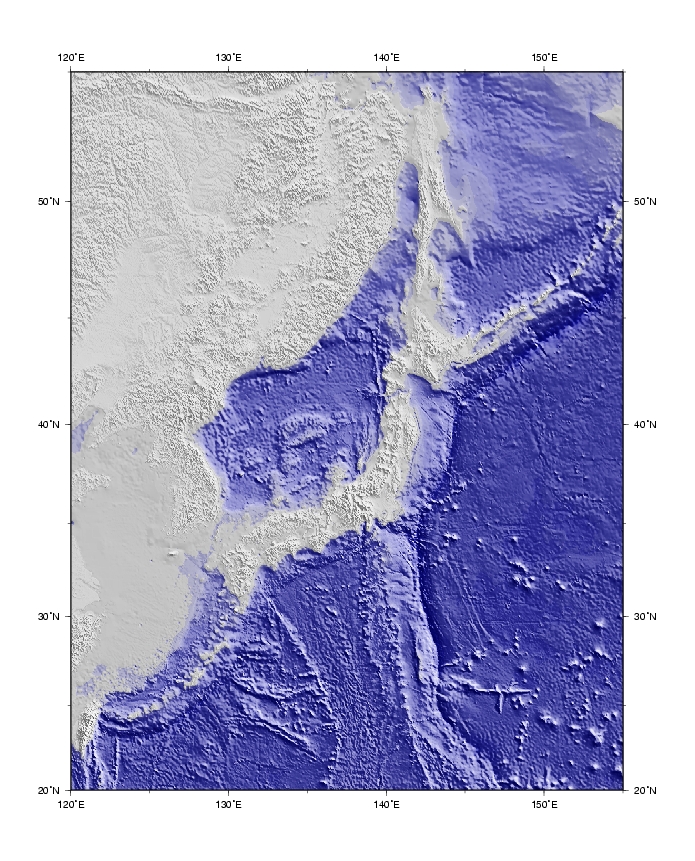
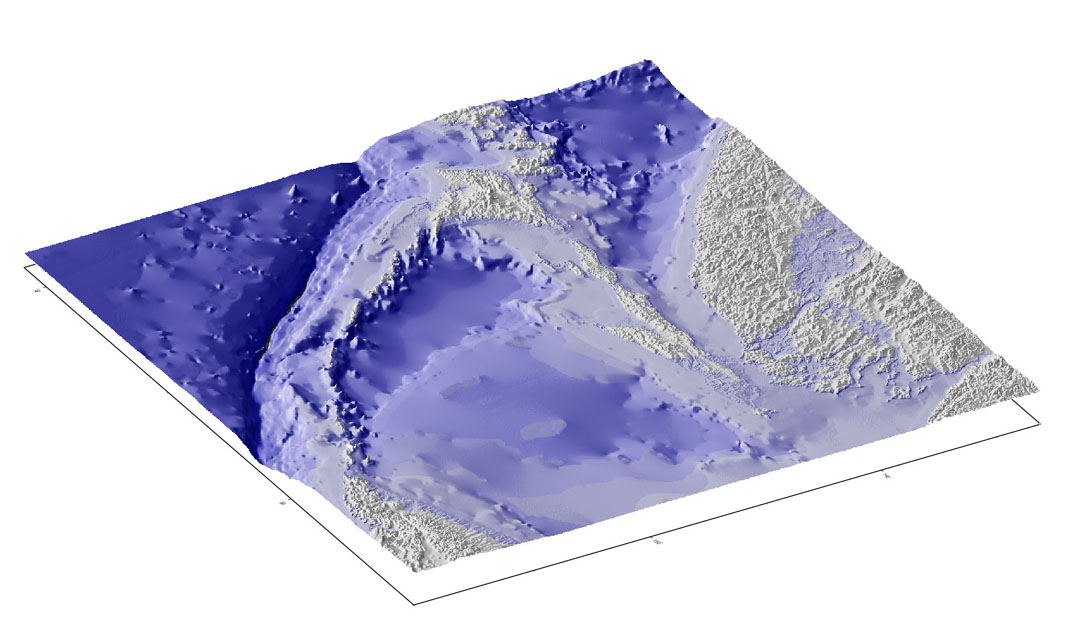
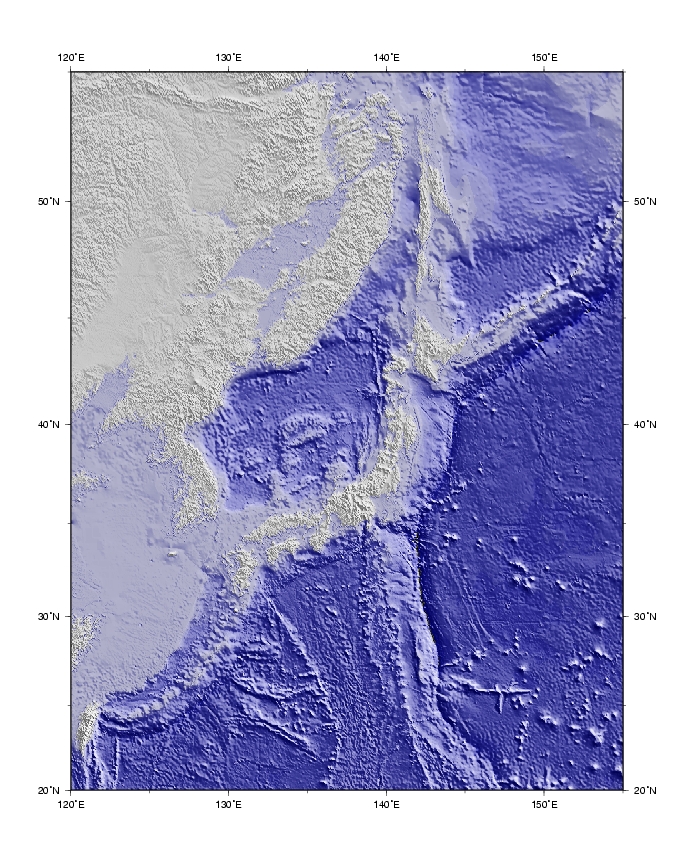
In the Last Glacial Maximum (LGM) the sea-level is 130 m lower than present-day level. These pictures are GMT works around Japan in LGM.
From South
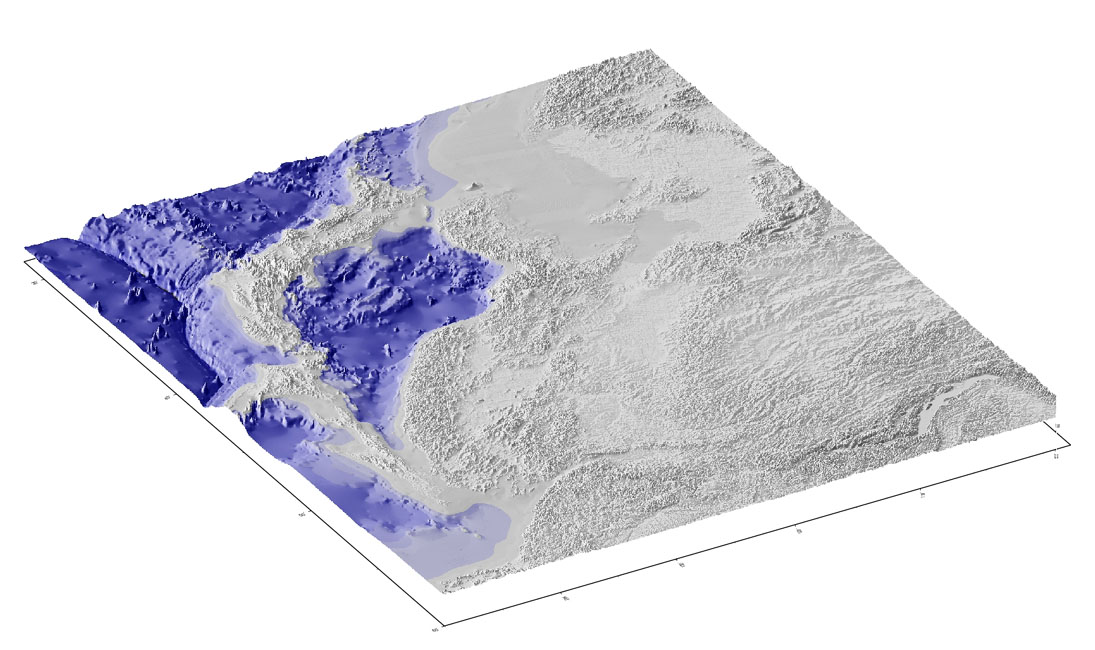
From Southwest
cptLGM
-10000  15      15      130     -9000   15      15      130
-9000   20      20      145     -8000   20      20      145
-8000   34      34      150     -7000   34      34      150
-7000   49      49      152     -6000   49      49      152
-6000   64      64      157     -5000   64      64      157
-5000   76      75      164     -4000   76      76      164
-4000   95      95      180     -3000   95      95      180
-3000   110     110     190     -2000   110     110     190
-2000   126     126     196     -1000   126     126     196
-1000   141     141     195     -500    141     141     195
-500    158     158     196     -300    158     158     196
-300    173     173     199     -130    173     173     199
-130    195     195     195     0       195     195     195
0       210     210     210     8000    210     210     210
B       0       0       0
F       255     255     255
N       128     128     128
see ``GMT on Japan''
#! /bin/sh
gmtset PAPER_MEDIA a1+
output=northern.ps
grdview YOUR_JAPAN.GRD \
-JG140/45/15i -JZ3 \
-R115/25/150/60r -Ba10f5/a10f5 \
-Qi -E30/30 -CcptLGM -Itmp.hst3 -V -P -Z1000 \
> $output
#! /bin/sh
gmtset PAPER_MEDIA a1+
output=southern.ps
grdview YOUR_JAPAN.GRD \
-JW125/15i -JZ3 \
-R110/145/20/48 -Ba10f5/a10f5 \
-Qi -E195/30 -CcptLGM -Itmp45.hst3 -V -P -Z1000 \
> $output
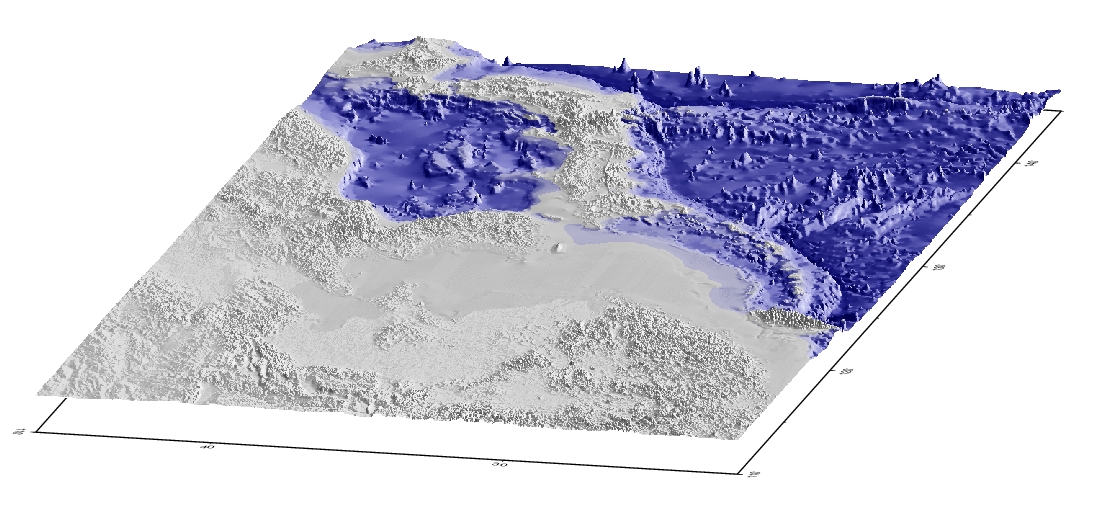
#! /bin/sh
gmtset PAPER_MEDIA a1+
output=shanghai_L.ps
grdview YOUR_JAPAN.GRD \
-JX40i/20i -JZ4 \
-R110/22/145/46r -Ba10f5/a10f5 \
-Qi -E257/15 -CcptLGM -Itmp.hst3 -V -P -Z1000 \
> $output
cpt+100
-9000	20	20 	145	-8000	20	20	145
-8000	34	34	150	-7000	34	34	150
-7000	49	49	152	-6000	49	49	152
-6000	64	64	157	-5000	64	64	157
-5000	76	75	164	-4000	76	76	164
-4000	95	95	180	-3000	95	95	180
-3000	110	110	190	-2000	110	110	190
-2000	126	126	196	-1000	126	126	196
-1000	141	141	195	-500	141	141	195
-500	158	158	196	-300	158	158	196
-300	173	173	199	100	173	173	199
100	195	195	195	8000	195	195	195
B       0       0       0
F       255     255     255
N       128     128     128
see ``GMT on Japan''
okhotsk.sh
#! /bin/sh
gmtset PAPER_MEDIA a1+
output=okhotsk.ps
grdview YOUR_JAPAN.GRD \
-JG140/45/15i -JZ3 \
-R135/40/160/55r -Ba10f5/a10f5 \
-Qi -E30/30 -Ccpt+100 -Itmp.hst3 -V -P -Z1000 \
> $output
http://www.bodc.ac.uk/data/online_delivery/gebco/http://www.ngdc.noaa.gov/mgg/fliers/01mgg04.html