GMT on Japan
GMT on Japan
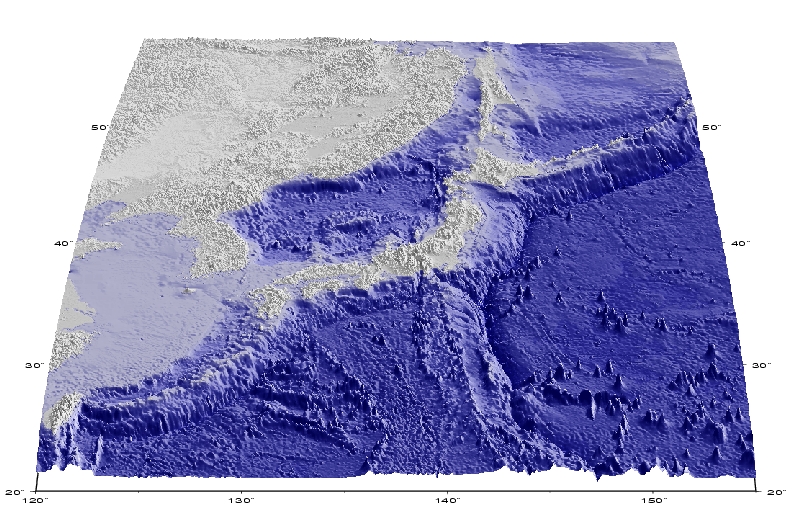
Bird's view
Intensity file
grdgradient YOUR_JAPAN.GRID -A45 -Gtmp45.grad -V -Ne0.8
grdhisteq tmp45.grad -Gtmp45.hst -N -V
grdmath tmp45.hst 3  / = tmp45.hst3
Colour palette file
cptbluegrey
-10000  15      15      130     -9000   15      15      130
-9000   20      20      145     -8000   20      20      145
-8000   34      34      150     -7000   34      34      150
-7000   49      49      152     -6000   49      49      152
-6000   64      64      157     -5000   64      64      157
-5000   76      75      164     -4000   76      76      164
-4000   95      95      180     -3000   95      95      180
-3000   110     110     190     -2000   110     110     190
-2000   126     126     196     -1000   126     126     196
-1000   141     141     195     -500    141     141     195
-500    158     158     196     -200    158     158     196
-200    173     173     199     0       173     173     199
0       195     195     195     100     195     195     195
100     210     210     210     8000    210     210     210
B       0       0       0
F       255     255     255
N       128     128     128
GMT script
gmtset PAPER_MEDIA a1+
gmtset DEGREE_FORMAT 2
gmtset ANOT_FONT_SIZE 18
output=blujapan_cho.ps
grd=YOUR_JAPAN.GRD
grdview $grd \
-JW140/10i -JZ2 \
-R120/155/20/55 -Ba10f5/a10f5 \
-Qi -E180/30 -Ccptblugrey -Itmp45.hst3 -V -P -Z-10000 \
> $output
Plan-view
Lambert Conic Projections
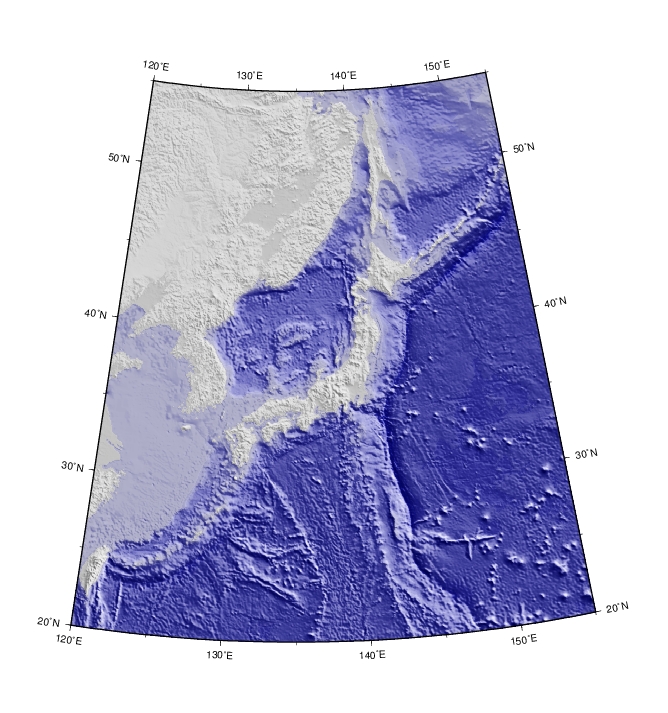
Intensity and colour palette files are same as
above.
gmtset PAPER_MEDIA a1+
gmtset BASEMAP_TYPE plain
gmtset DEGREE_FORMAT 3
gmtset ANOT_FONT_SIZE 10
output=blujapan.ps
grd=YOUR_JAPAN.GRD
grdimage $grd \
-Jl135/42.5/25/45/1:20000000 \
-R120/155/20/55 -Ba10f5/a10f5 \
-Ccptblugrey -Itmp45.hst3 -V -P \
> $output
Mercator Cylindrical Projections
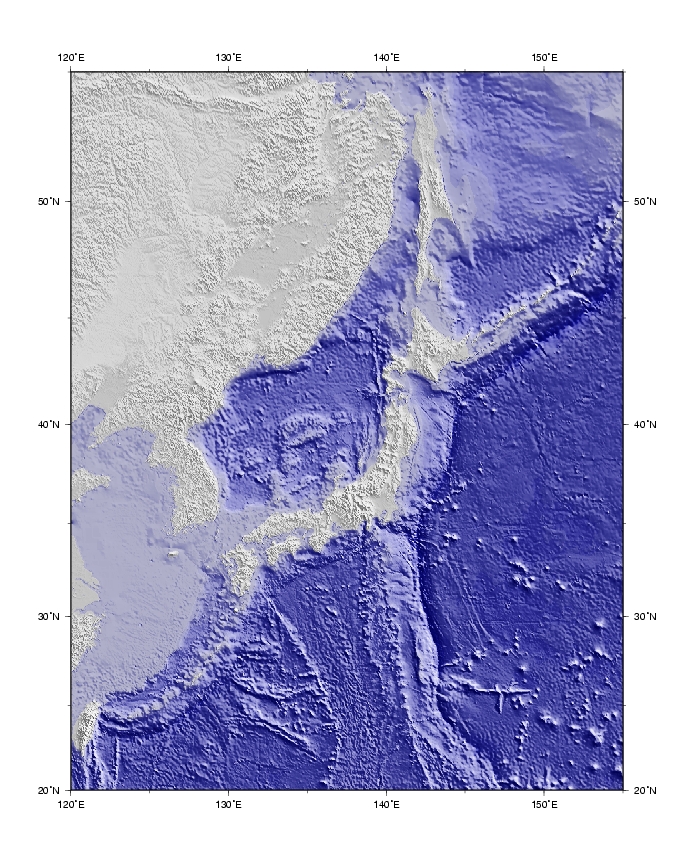
Intensity and colour palette files are same as
above.
gmtset PAPER_MEDIA a1+
gmtset BASEMAP_TYPE plain
gmtset DEGREE_FORMAT 3
gmtset ANOT_FONT_SIZE 10
output=blujapan.ps
grd=YOUR_JAPAN.GRD
grdimage $grd \
-Jm1:20000000 \
-R120/155/20/55 -Ba10f5/a10f5 \
-Ccptblugrey -Itmp45.hst3 -V -P \
> $output
Acknowldgements
I used following grid data on above caliculated pictures.
ETOPO2(NOAA,NGDC):
http://www.ngdc.noaa.gov/mgg/fliers/01mgg04.html
These pictures are indebted to
Drs. Tanimura and Uemura of Natural Science Museum, Tokyo, Japan.